
やること
Nvidia A100/H100専用クーラーのお問い合わせが多くて驚いています。GPU温度がどれくらい下がるか、これから測定してデータを公開したいと思いますのでお待ちください。。
ということでA100の温度ベンチマークを取りたいのですが、ゲーミングではなく計算専用のためか、グラフィック系のベンチマークソフトが軒並み非対応のようでした(そもそも映像出力がなくてSSH接続してるし)。そこでCUIで負荷を与えられるソフトを見つけたので、温度ベンチを取る備忘録を残しておきます。
GPU使用率や温度の記録方法
「nvidia-smi」コマンドを使用します。次を実行すると1秒毎にカンマ区切りで表示されるので、Ctrl+Cで中断してから丸ごとコピーしてExcelに貼り付ければOKです。
nvidia-smi -l 1 --query-gpu=timestamp,utilization.gpu,utilization.memory,memory.total,memory.free,memory.used,fan.speed,temperature.gpu,temperature.memory,power.draw,power.limit --format=csvtimestamp, utilization.gpu [%], utilization.memory [%], memory.total [MiB], memory.free [MiB], memory.used [MiB], fan.speed [%], temperature.gpu, temperature.memory, power.draw [W], power.limit [W]
2024/06/17 22:22:31.564, 0 %, 0 %, 81920 MiB, 81037 MiB, 0 MiB, [N/A], 37, 51, 46.59 W, 300.00 W
2024/06/17 22:22:32.573, 0 %, 0 %, 81920 MiB, 81037 MiB, 0 MiB, [N/A], 37, 51, 46.58 W, 300.00 W
2024/06/17 22:22:33.575, 0 %, 0 %, 81920 MiB, 81037 MiB, 0 MiB, [N/A], 37, 51, 46.20 W, 300.00 W
2024/06/17 22:22:34.575, 0 %, 0 %, 81920 MiB, 81037 MiB, 0 MiB, [N/A], 37, 51, 46.30 W, 300.00 W
2024/06/17 22:22:35.576, 0 %, 0 %, 81920 MiB, 81037 MiB, 0 MiB, [N/A], 37, 51, 46.59 W, 300.00 W
・
・
・メモリ80GBは圧巻ですね。消費電力は最大300Wとのこと。
GPU負荷ソフト
「gpu-burn」というソフトを使用しました。アチアチになりそう。
ダウンロードして、
git clone https://github.com/wilicc/gpu-burnディレクトリに入ります。
cd gpu-burnmakeすると「gpu_burn」という実行ファイルができるので、
makeオプションを付けてこれを実行します。テンソルコアを使用して300秒の負荷を開始。
./gpu_burn -tc -d 300オプションはヘルプから見られます。
######@######:~/######/gpu-burn$ ./gpu_burn -h
GPU Burn
Usage: gpu-burn [OPTIONS] [TIME]

-m X    Use X MB of memory.
-m N%   Use N% of the available GPU memory.  Default is 90%
-d      Use doubles
-tc     Try to use Tensor cores
-l      Lists all GPUs in the system
-i N    Execute only on GPU N
-c FILE Use FILE as compare kernel.  Default is compare.ptx
-stts T Set timeout threshold to T seconds for using SIGTERM to abort child processes before using SIGKILL.  Default is 30
-h      Show this help message

Examples:
  gpu-burn -d 3600 # burns all GPUs with doubles for an hour
  gpu-burn -m 50% # burns using 50% of the available GPU memory
  gpu-burn -l # list GPUs
  gpu-burn -i 2 # burns only GPU of index 2
結果
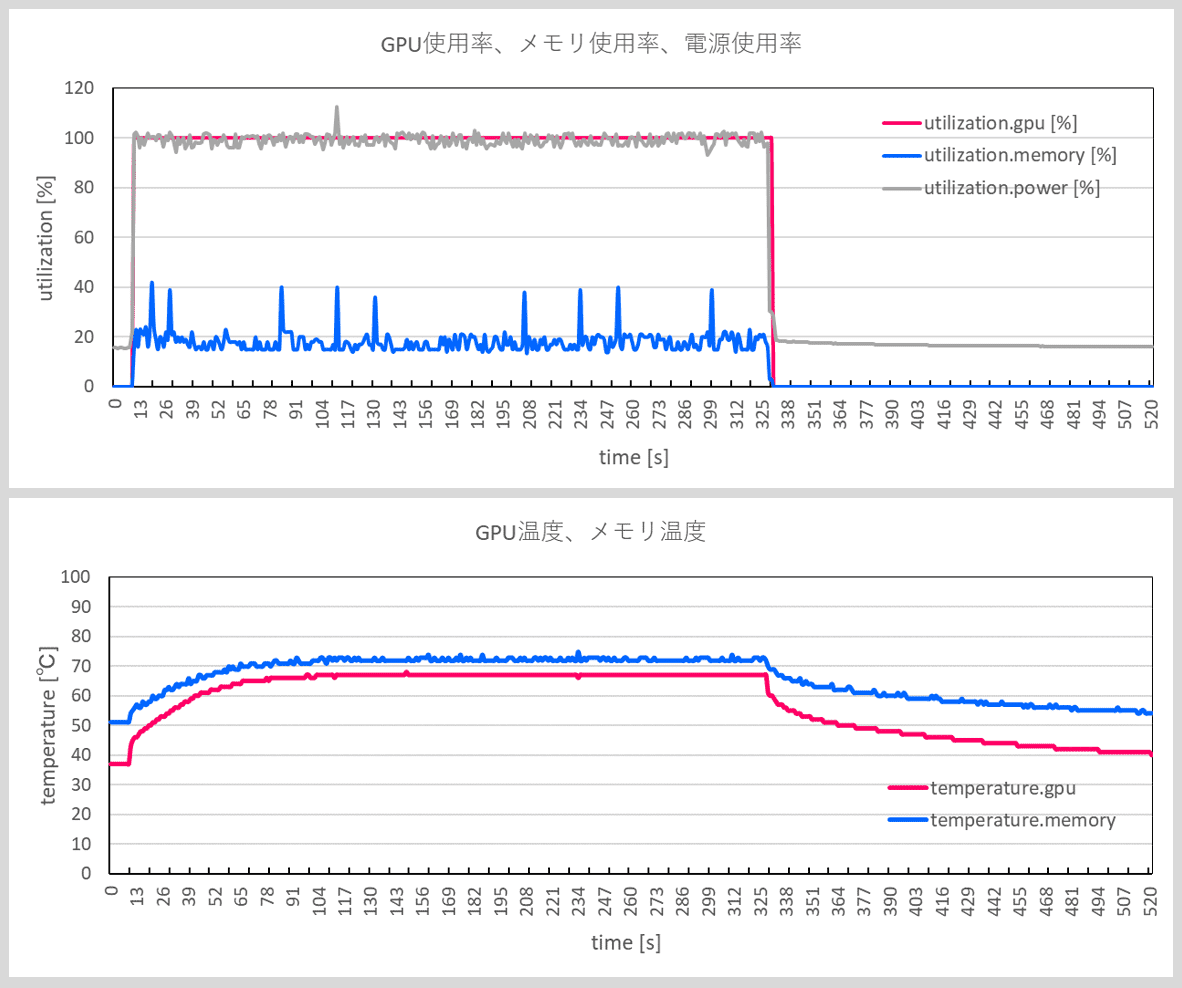
gpu-burn側の出力です。なんとなく67℃まで上がってることが分かります。
######@######:~/######/gpu-burn$ ./gpu_burn -tc -d 300
Using compare file: compare.ptx
Burning for 300 seconds.
GPU 0: NVIDIA A100 80GB PCIe (UUID: GPU-fc99fe47-0ce5-eaa6-9962-92140db37bd8)
Initialized device 0 with 81037 MB of memory (80602 MB available, using 72542 MB of it), using DOUBLES, using Tensor Cores
Results are 536870912 bytes each, thus performing 139 iterations
11.7%  proc'd: 417 (16522 Gflop/s)   errors: 0   temps: 58 C
        Summary at:   2024年  6月 17日 月曜日 22:23:15 JST

22.0%  proc'd: 973 (16323 Gflop/s)   errors: 0   temps: 65 C
        Summary at:   2024年  6月 17日 月曜日 22:23:46 JST

33.3%  proc'd: 1390 (16227 Gflop/s)   errors: 0   temps: 67 C
        Summary at:   2024年  6月 17日 月曜日 22:24:20 JST

43.7%  proc'd: 1946 (16258 Gflop/s)   errors: 0   temps: 67 C
        Summary at:   2024年  6月 17日 月曜日 22:24:51 JST

55.0%  proc'd: 2363 (16272 Gflop/s)   errors: 0   temps: 67 C
        Summary at:   2024年  6月 17日 月曜日 22:25:25 JST

65.7%  proc'd: 2919 (16242 Gflop/s)   errors: 0   temps: 67 C
        Summary at:   2024年  6月 17日 月曜日 22:25:57 JST

76.7%  proc'd: 3336 (16257 Gflop/s)   errors: 0   temps: 67 C
        Summary at:   2024年  6月 17日 月曜日 22:26:30 JST

87.7%  proc'd: 3892 (16166 Gflop/s)   errors: 0   temps: 67 C
        Summary at:   2024年  6月 17日 月曜日 22:27:03 JST

98.3%  proc'd: 4309 (16242 Gflop/s)   errors: 0   temps: 67 C
        Summary at:   2024年  6月 17日 月曜日 22:27:35 JST

100.0%  proc'd: 4448 (16232 Gflop/s)   errors: 0   temps: 67 C
Killing processes with SIGTERM (soft kill)
Freed memory for dev 0
Uninitted cublas
done

Tested 1 GPUs:
        GPU 0: OK
nvidia-smi側の出力をグラフにしました。
おわりに
GPU使用率と電源使用率は100%に張り付きました。一方、メモリ使用率はデフォルト設定で90%のはずが20%程度しか使えませんでした。さすがに80GBもあるから??テンソルコアが使えているかどうか確認したほうがいいと思います。
GPU温度は67℃までしか上がりませんでした。けっこう低めです。A100にはファンが付いていませんが、今回のケースではケースから風がよく当たっているようです(は?)。
ですので今回は専用クーラーを付ける必要がありません。お問い合わせを頂いている中で専用クーラーが有効だった例は、通常のゲーミングPC用ケースで使用していて深層学習時に100℃まで上がって落ちるというものでした。専用クーラーを納品しましたが、付けた後の温度ベンチが取れていません…。これから取ります。